CASTLE MINE COMPLEX
Infrastructure-Ready Silver Asset
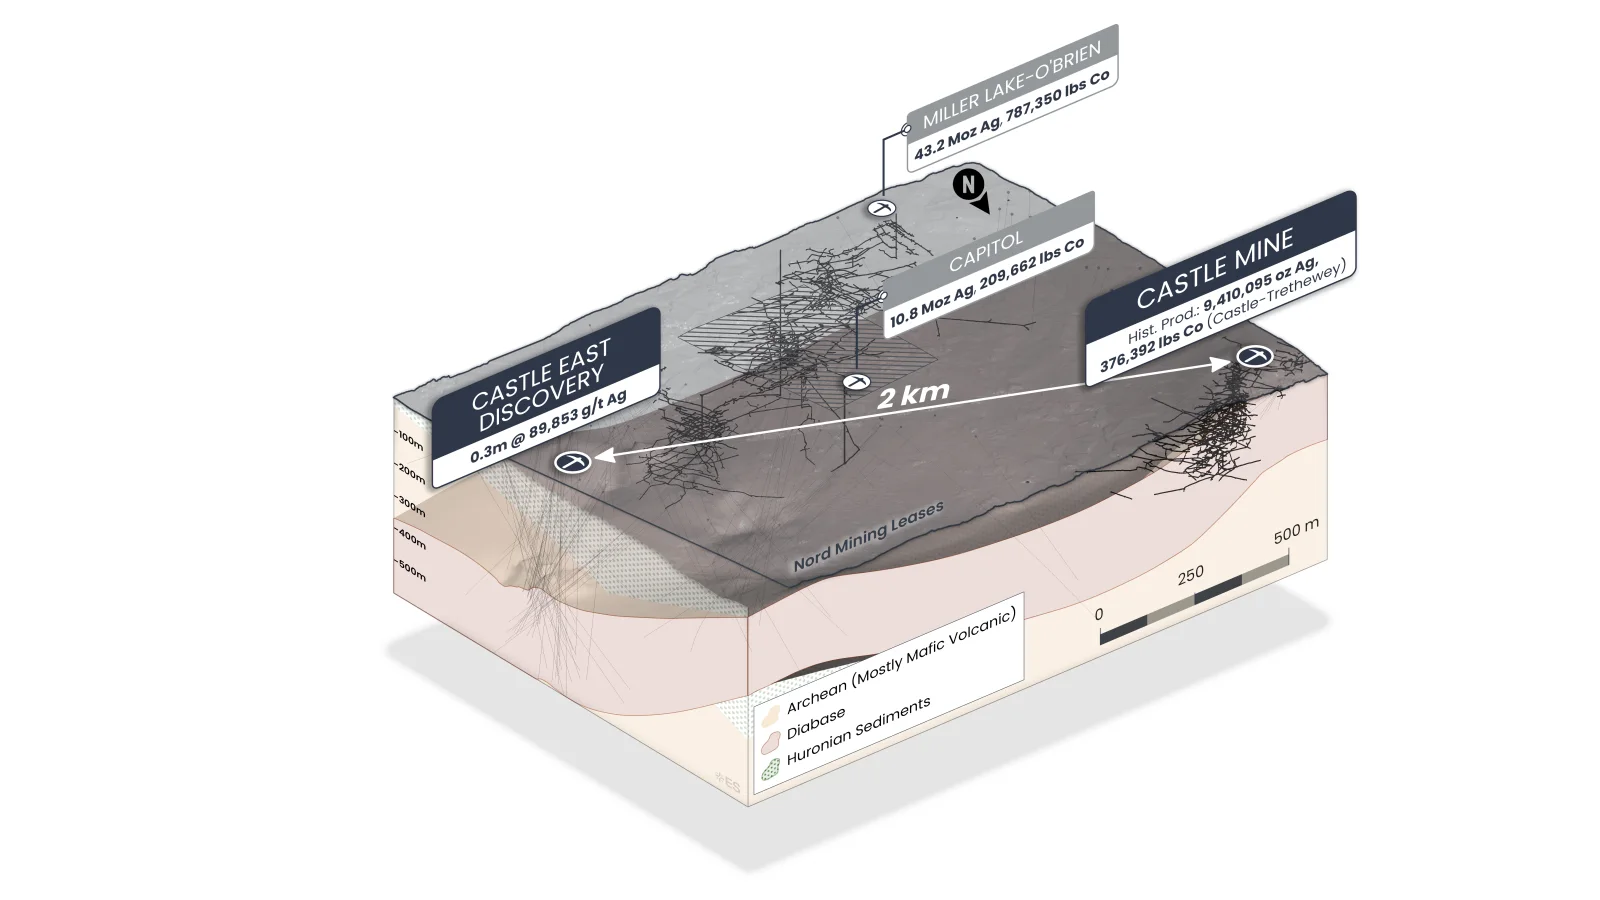
Past producer of 9.4 million ounces silver and 376,000 lbs cobalt. Three shafts access 11 levels to 259m depth. Level 1 rehabilitated with underground drilling returning up to 5.2% cobalt and 13,208 g/t silver. Miller Creek tailings grade up to 411 g/t AgEq.
NI 43-101 TECHNICAL REPORT (2015)
Past Production & Exploration Potential
DEVELOPMENT STATUS
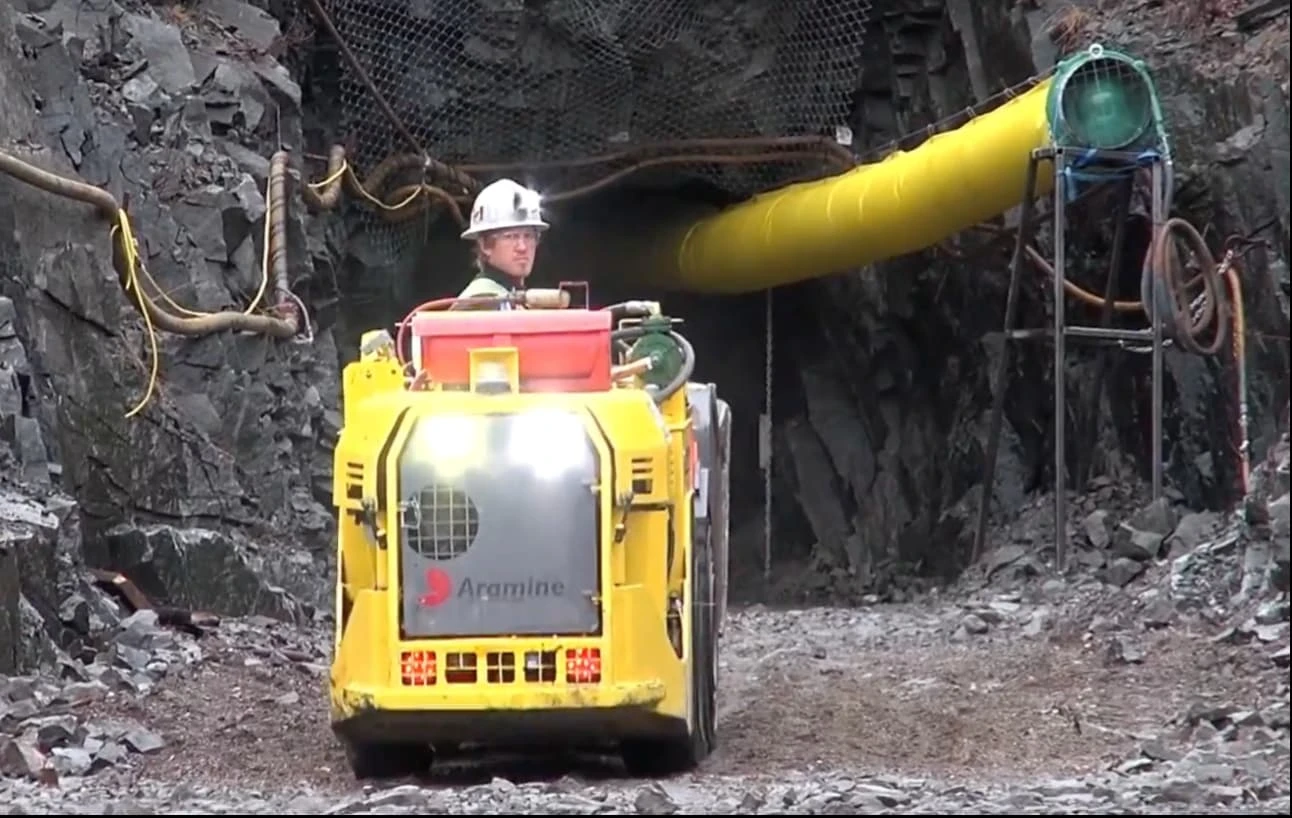
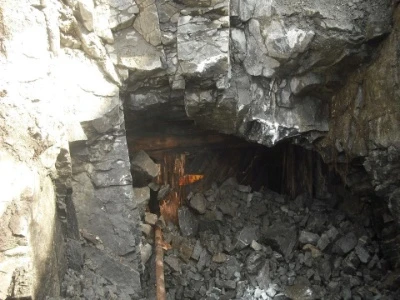
Underground Access Established
Adit to Level 1 rehabilitated for sampling and drilling. Underground mapping confirms multiple unmined vein structures. Broken ore remains in stopes from historic operations.
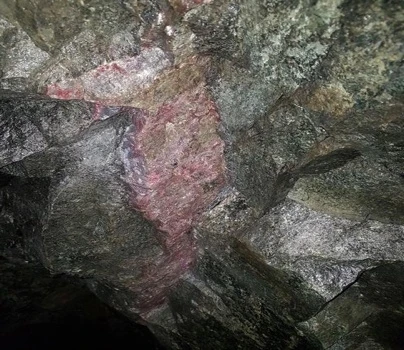
Level 1 Sampling
Channel samples: 5.2% Co, 5.3% Ni, 13,208 g/t Ag. Battery metal grades exceed historic silver-only focus.
2019 Underground Drilling
Discovery of 22 g/t gold zone. Multiple structures with combined silver-cobalt-nickel mineralization.
PRODUCTION RECORD
292.7 million grams silver from No. 3 shaft alone
Operating 1917-1989 with peak grades of 85 oz/ton (2,650 g/t). Infrastructure includes three shafts, extensive underground development, road access, and power. Only small portion of 78 km² property explored.
GEOLOGICAL SETTING
Nipissing diabase hosts high-grade veins
Drilling confirms mineralization in both diabase contacts. Modern understanding suggests deeper potential below historic workings. Archean volcanic rocks host gold zones.
GRADE EVOLUTION
Historic Mining Focused on Highest Grades
Selective mining left significant mineralization. Battery metals ignored as waste. Modern processing can handle material rejected by historic operations. The Castle, Capitol and Miller Lake-O'Brien workings sit within a 2 km radius and are interpreted as one silver-rich vein system — with Capitol workings extending beneath both Nord's existing leases and the newly acquired ground, pointing to continuity the historic, grade-driven operations never pursued.
1923-1930 Average
25 oz/ton silver, 1 lb/ton cobalt
1979-1989 Average
26 oz/ton (812 g/t) silver
Select Stopes
85 oz/ton (2,650 g/t) reported
3D MODELING
Integrated Historic and Modern Data
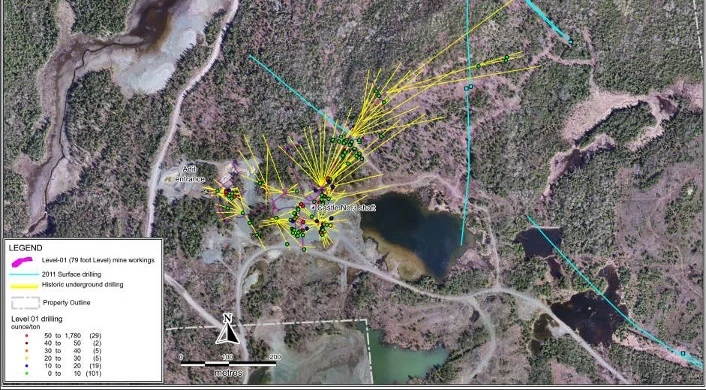
Drone surveys provide accurate surface topology. Underground workings digitized from historic plans. Modern drilling validates and expands historic datasets.
Pink: Level 1 Development
Accessible workings at 24m depth
Yellow: Underground Drilling
Fan drilling from Level 1 stations
Blue: Surface Drilling
12-hole program validating model
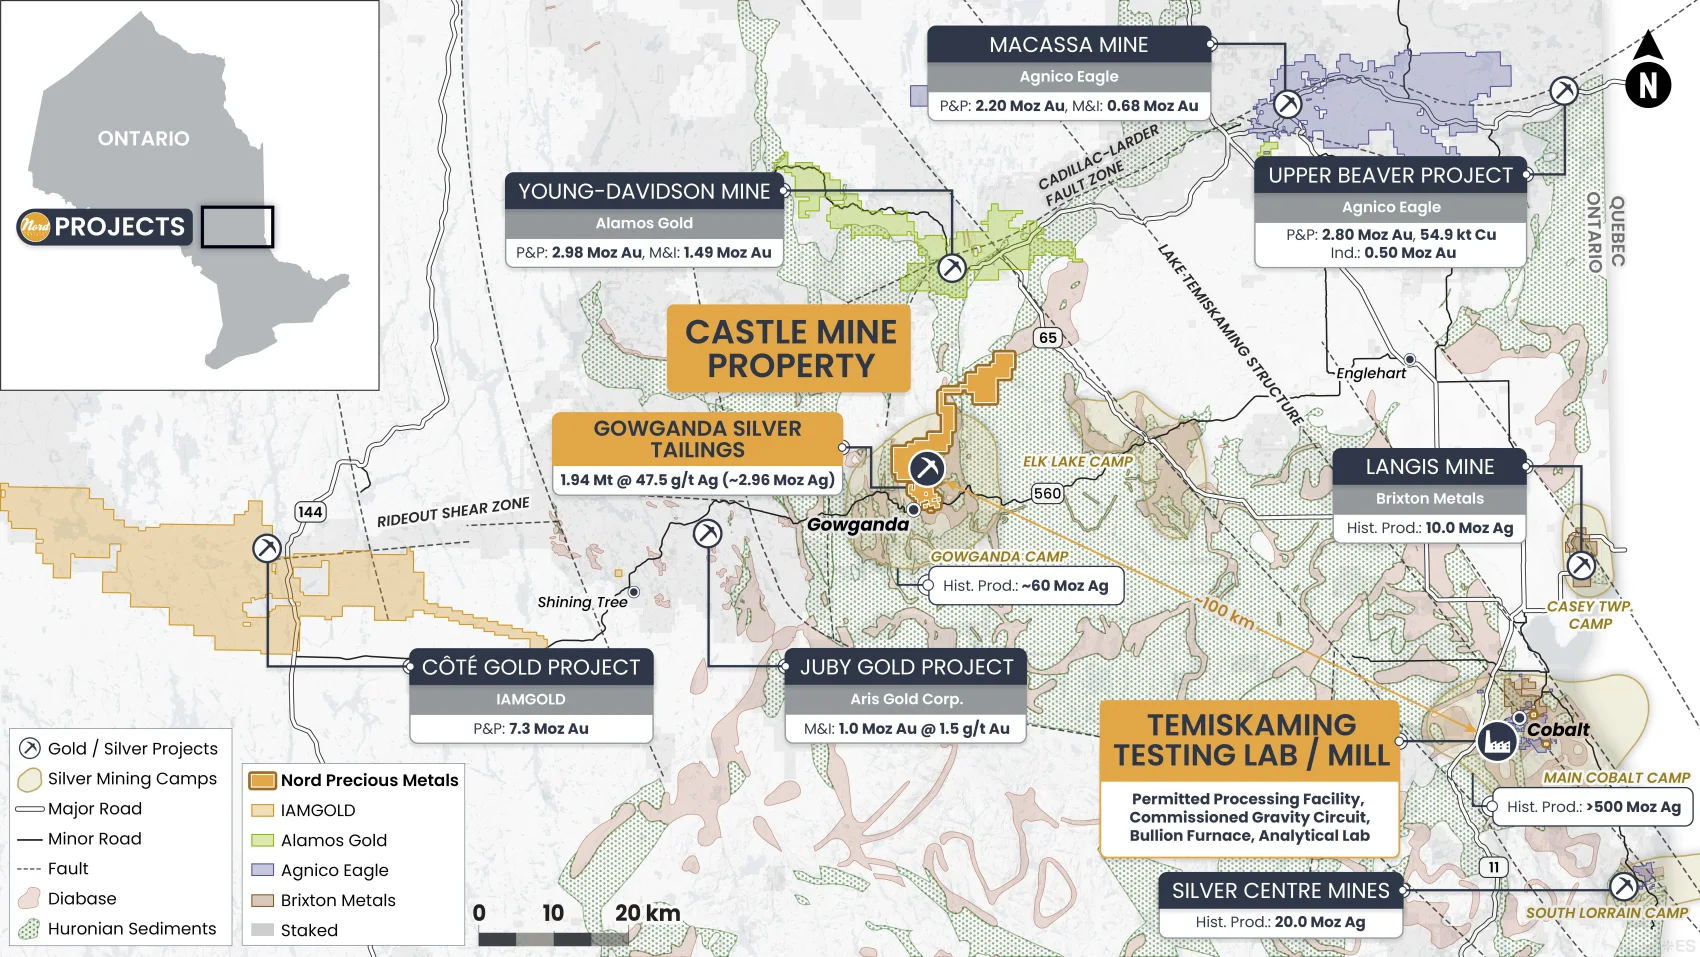
GOWGANDA SILVER CAMP
One of Canada's most prolific historic silver districts
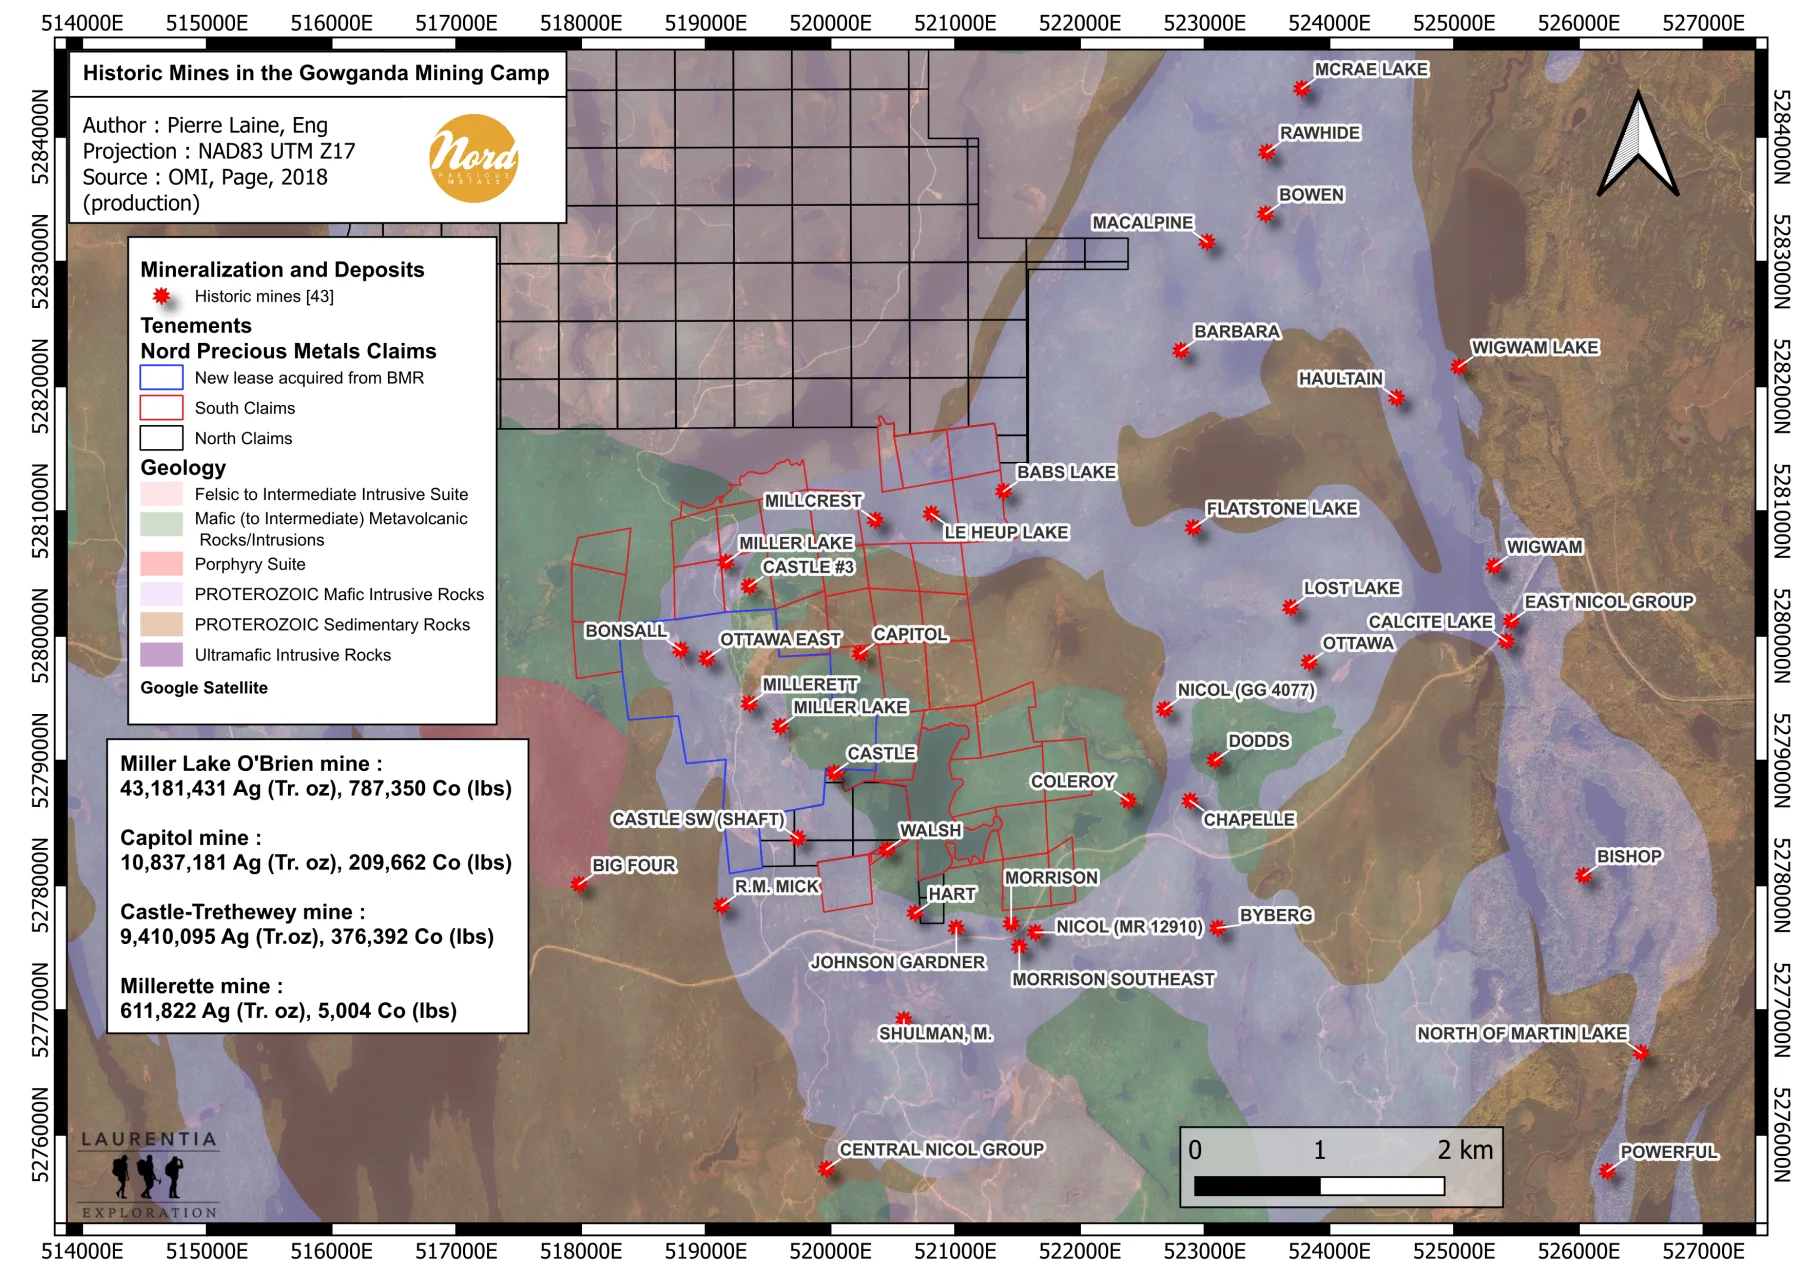
The Gowganda Camp is one of Canada's most prolific historic silver districts, with 43 documented past-producing mines. Following the March 2026 closing of four additional mining leases, Nord now hosts three of the five largest past producers in the camp — Miller Lake-O'Brien (Siscoe), Castle and Millerett — and controls nearly 4 kilometres of historic property boundary, roughly half of it through areas of documented past production. Because historic operators could not mine across these property lines, the high-grade structures and veins running toward them were never drilled. Nord now holds title to both sides, opening these previously inaccessible boundary zones to exploration.
11 Levels of Development
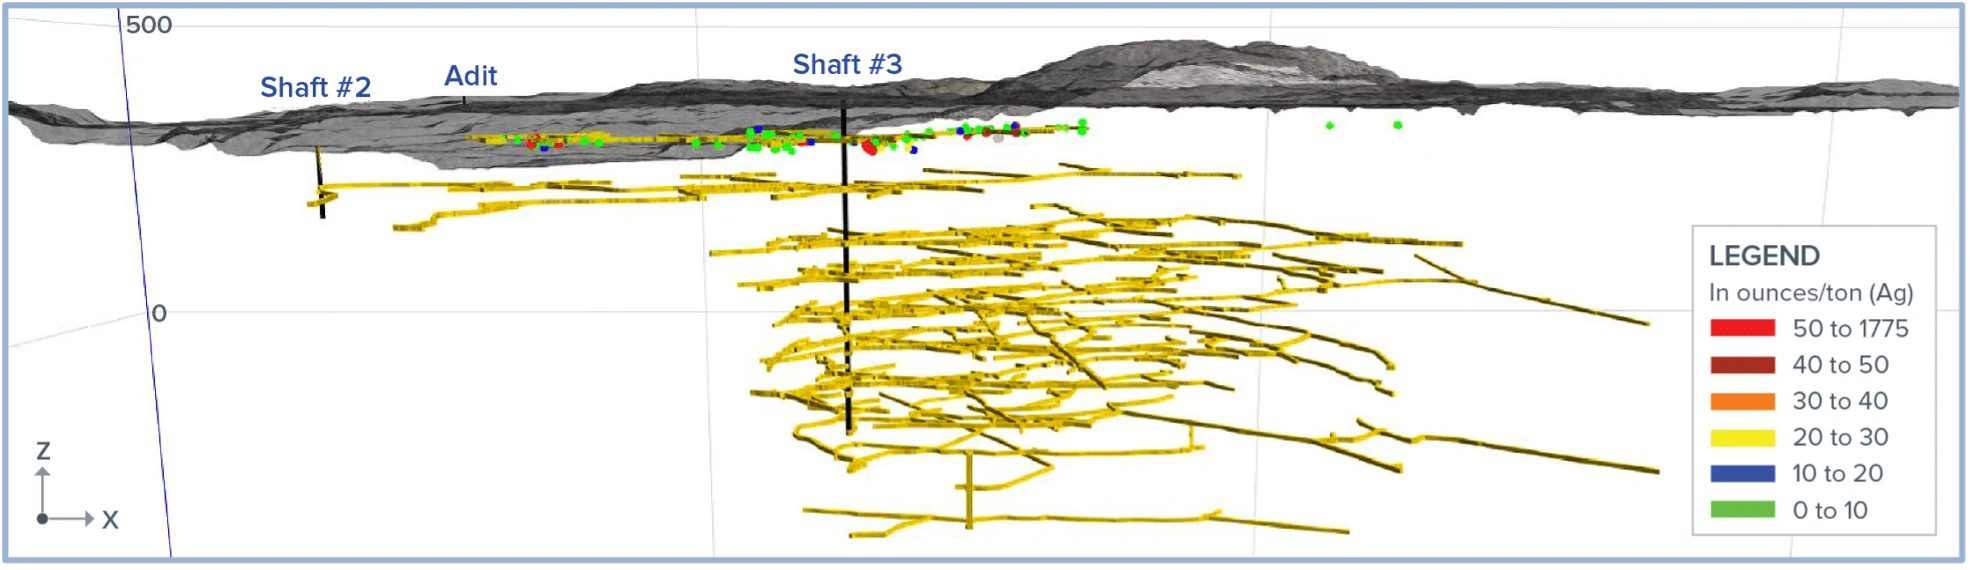
Longitudinal section shows extensive workings to 259m (850 feet). Most levels partially mined. Significant strike extensions unexplored.
Geophysical Integration
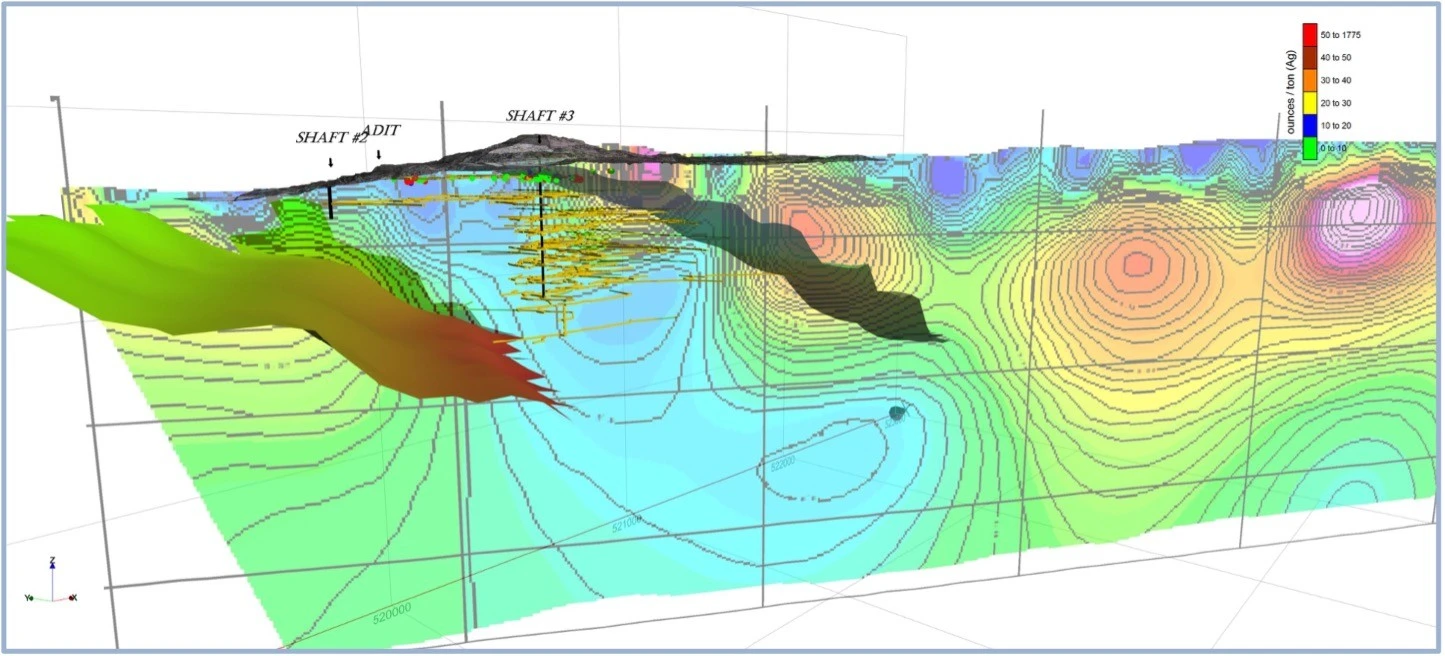
2011 IP survey shows high resistivity correlating with diabase. Low resistivity zones suggest sulfide mineralization targets.